A rewarding aspect of parenthood, particularly for those of us with a penchant for numbers and all things mechanical, is seeing your children applying their learning in unexpected ways. This was certainly the case recently with my daughter, Nina, and her latest statistics project.
Her report was an "Investigation on the Impact of Drivetrain Type on Vehicle Performance in Timed Events." Specifically, her project was to analyze a large dataset to draw meaningful conclusions. Finding suitable data for her original, more abstract topic proved to be a bit of a challenge so I suggested she utilize the wealth of lap time data readily available on the KWRC (Kitchener Waterloo Rally Club) website.
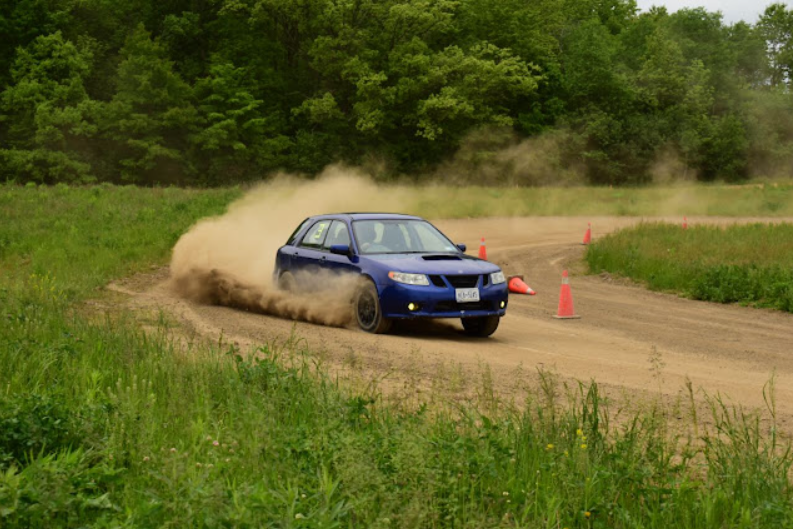
What better way to explore vehicle performance than by looking at real-world results from local rallycross events? Nina attacked the data knowing it was worth a significant portion of her final grade. Her analysis focuses on the top 21 cars from the first three events of the 2024 KWRC rallycross season.
The resulting report is a fascinating deep dive into how different drivetrain types—Two-Wheel Drive (2WD) and Four-Wheel Drive (4WD)—might influence a car's speed and consistency on the varied terrain of a rallycross course. If you're into numbers, or just curious about the nitty-gritty of car performance, please take a moment to read her full report, featured below.
Investigating The Impact of Drivetrain Type on Vehicle Performance in Timed Events
By Nina D.
Thesis
Does four-wheel drive (4WD) or two-wheel drive (2WD) technology confer a statistically significant performance advantage in dirt track rally cross racing, considering variables such as finish times/lap times and track layouts?
Hypothesis
In this project I expect to find that four-wheel drive vehicles will exhibit a statistically significant advantage over the two-wheel driver racers in dirt track rally cross racing because of the advantages like having more traction & control especially in challenging conditions.
Population
The population of this study will be top 21 rally cars that competed in the Eagles Nest Rally Cross Course from the 2024 events 1,2 & 3. This event is hosted by the Kitchener Waterloo Rally Club.
Characteristics
Vehicle type: four-wheel drive and two-wheel drive cars. These are designed for various surfaces for rallycross.
Course environment: in this case the race took place at Eagles Nest Rally Cross Course which is a smooth dirt track with blind corners, several chicanes and long hairpin corners.
Event structure: All events have multiple runs where each competitor completes a competitive lap at a time. The goal was to complete at least 4 laps per car by the end of the event. The winner is determined by the shortest total time across all competitive runs.
Sample: my sample for this project will be all the performance data from these 3 events and times and the positions of finishes.
Independent variables
- Drive train type, this is the main characteristic I will be comparing in the project. There are two types of train drivers, four-wheel drive and two-wheel drive.
- The events of the performances (1,2,3)
Dependent variables
- Run times/lap times how fast a car can complete a lap. Because the event is rallycross, there are individual runs
- Overall finishing position: what place a car comes in
Sub questions to help answer my thesisOn average, how do the fastest run times of 4WD cars compare to 2WD cars across all three events?
What is the distribution of lap times for 4WD vs. 2WD cars in each event? (mean, median, range, stand deviation)
How does the overall finishing positions of 4WD cars compare to 2WD cars in each of the 3 events?
Sub question #1 How do the overall finishing positions of 4WD cars compare to 2WD cars in each of the 3 events?
Graph 1.0
Analysis
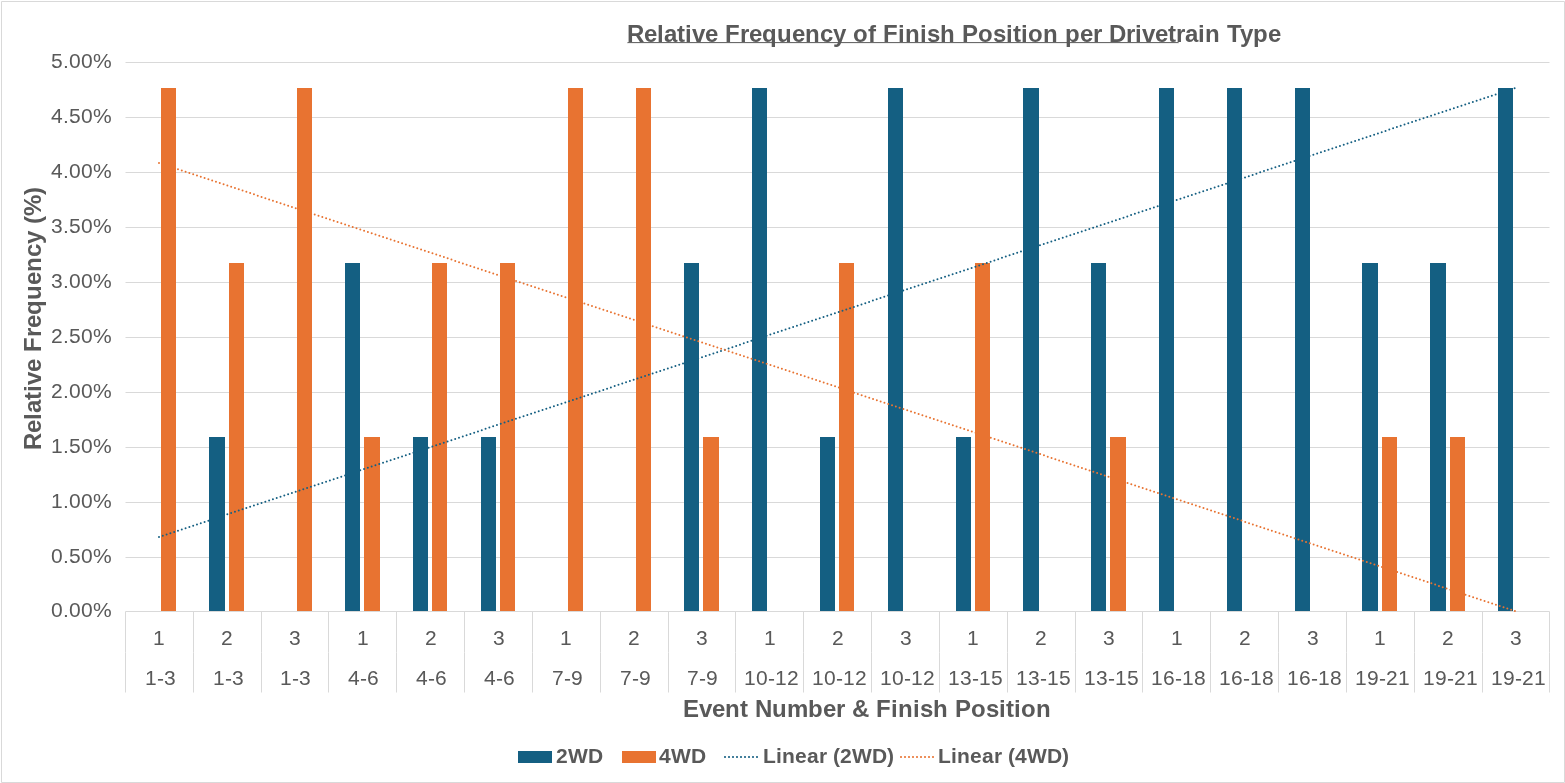
In the graph above of Relative Frequency of Finish Position per Drivetrain Type, the graph shows the relative frequency of the different finishing positions of 2WD and 4WD cars across three different events. The graph compares how often each drivetrain type finishes in various positions in subgroups of 3.
The general trend that I see on the graph is that the 2WD cars (blue bars) show that over the three events there is a higher frequency of the cars finishing in a lower finish position. The majority of the 2WD cars tend to finish lower, in positions like 16-18. This is seen by the trend line (blue) on the graph. The linear trend line for the 2WD cars is increasing on the graph, meaning that the relative frequency of lower finish position increases for the 2WD cars.
On the other hand, the 4WD cars (orange bars) have a stronger performance represented by a trend line that decreases. This shows a decline in lower finish position frequency. This can help me conclude that drivetrain type matters in performance races and that 4WD cars may handle the course better than 2WD cars because of the observed frequency of wins.
This bar graph answers the sub question above and my conclusion is that the 4WD cars overall finishing positions is more probable to result in a winning position. This helps me answer the question to my thesis to visually see that 4WD cars have an advantage over 2WD cars in performance rally.
Table 1.0 for graph 1.0 found above
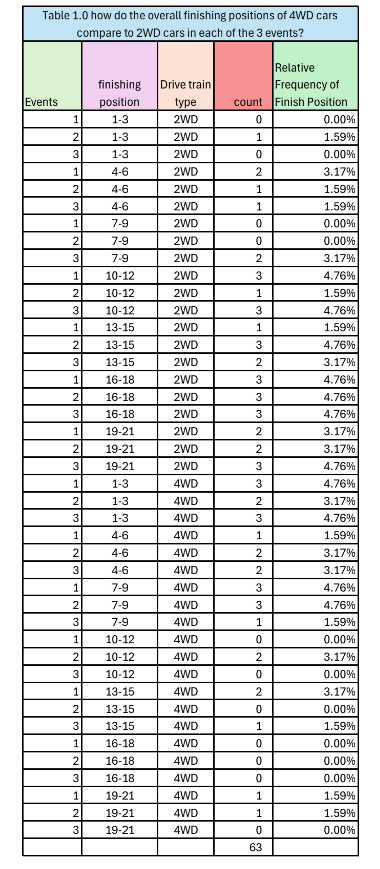
Table 1.0 for this graph shows the raw data and exact values for each event number. This table gives the raw evidence behind the trends explained in the analysis and shows the exact car count that finished in each group of finish positions.
For example, one can see that in a 2WD car only finished in the top 3 positions once in three events, a probability of 1/9 (p=0.111) whereas the 4WD cars finished in the top 3 positions 8 times, a probability of 8/9 (p=0.889).
Sub question 2: On average, how do the fastest run times of 4WD cars compare to 2WD cars across all three events?
Graph 2.0
Analysis
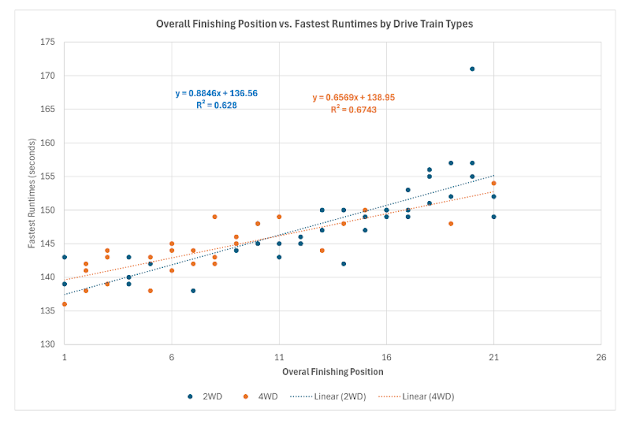
In this graph, Overall Finishing Position vs. Fastest Runtimes by Drive Train Types looks at the individual finish positions as well as the fastest run times for each car per event.
The 2WD has a steeper slope than the 4WD. This means that there is a greater change in runtime between positions compared with the 4WD cards.
4WD has a slighter slope, the car times change less compared with their final positions which shows more consistency for this type of drive train.
However, what is interesting from this graph is that the 2WD cars did have some of the fastest run times. However, the 4WD cars had more consistency.
There is an overlap in the graph for performance for both drivetrain types in the midrange of the finishing positions.
This scatterplot helps me answer sub question 2, and after learning about both drivetrain's linear regression equations and their slopes that the fastest run times of 4WD cars have a slighter slope and have more consistency for their fastest times.
This helps to answer the thesis question of whether the 4WD cars or 2WD cars have a better performance. From this graph I conclude that the 4WD cars are more consistent even when the 2WD cars had some of the fastest times.
Statistical:
Linear regression: using the line of best fit from this graph there are two equations:
The 4WD has the equation of 0.6569x + 138.95
The 2WD has the equation of y= 0.8846x = 136.56
The correlation coefficient, can be found by taking the square root of R^2
So, for 4WD R^2 is 0.6743 which then by taking the square root we get:
R= 0.821
For 2WD R^2 is 0.628 and when taking the square root:
R=0.0.792
4WD R= 0.821, R tells us that there is a positive linear relationship between finishing position and fastest runtimes. The R value suggests that there is a strong positive correlation between finishing position and fastest run times.
2WD, R=0.792 R is positive and tells us that there is a positive linear relationship between the finishing positions and the fastest runtimes.
The R^2 value tells us the percentage of variation that occurs. A higher R^2 means that the trendline fits the data better. For both 2WD and 4WD have moderate R^2 values. The higher R^2 value for 4WD cars means that the performance that the 4WD cars have is slightly more predictable and more consistent; their finishing positions are more closely related to their fastest times than the 2WD cars.
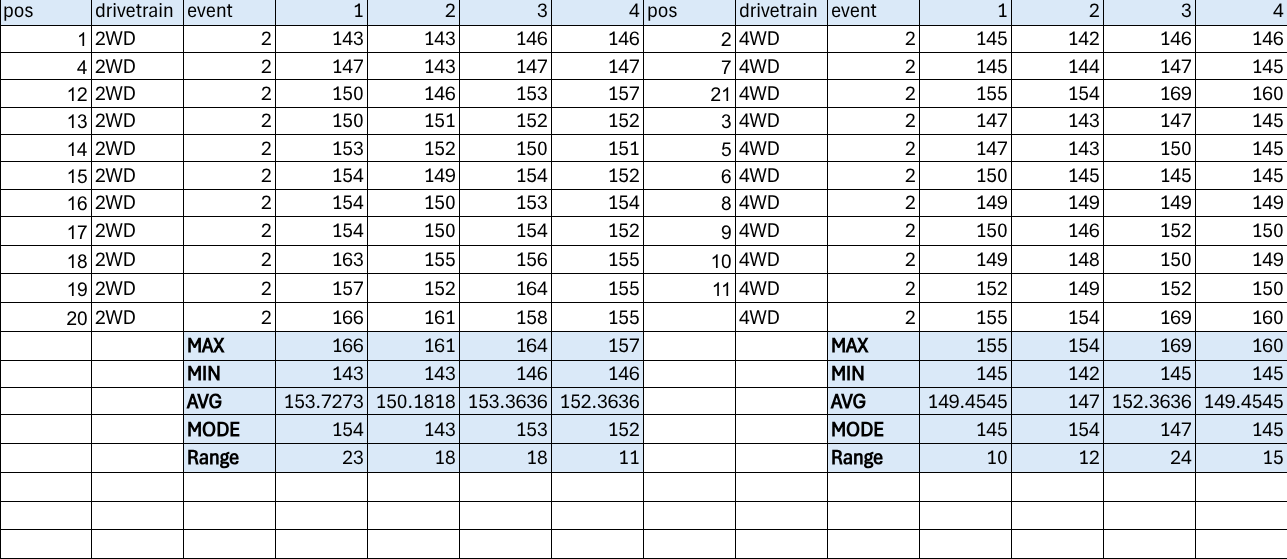
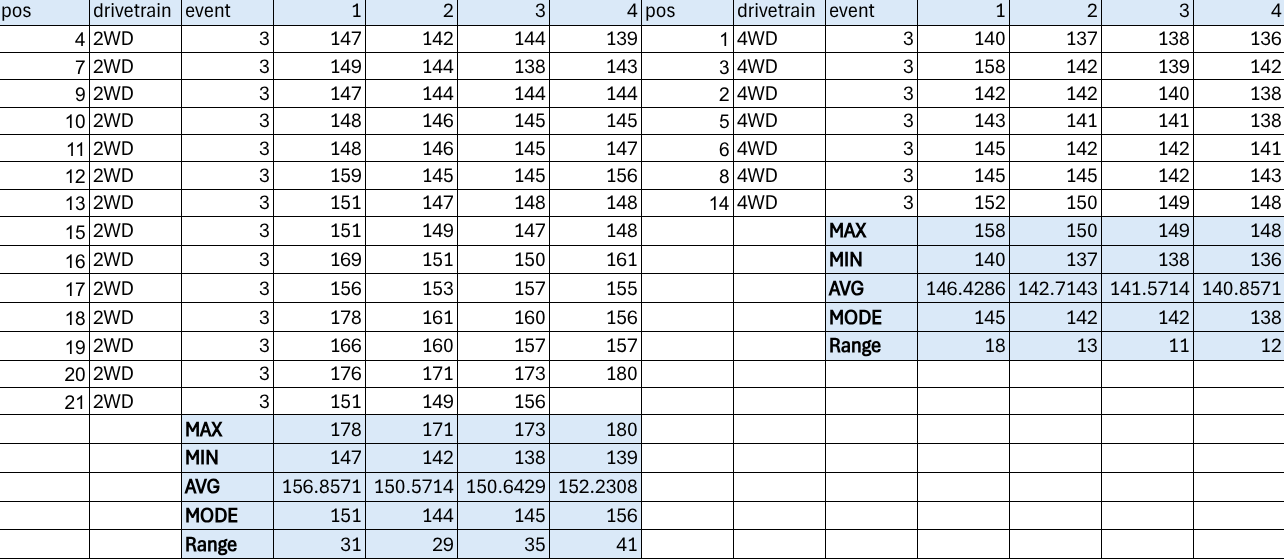
Sub question: What is the distribution of lap times for 4WD vs. 2WD cars in each event? (mean, median, range, standard deviation)
The tables below (3.0, 3.1, and 3.2) are a general statistical analysis where I was looking at maximum and minimum values for each vehicle drivetrain type per event to find the measures of central tendency.
With the maximum and minimum values from these tables I noticed that there was a potential variation in the range across the runs, which led me to create a box and whisker plot below, to further examine if there is variation.
Table 3.0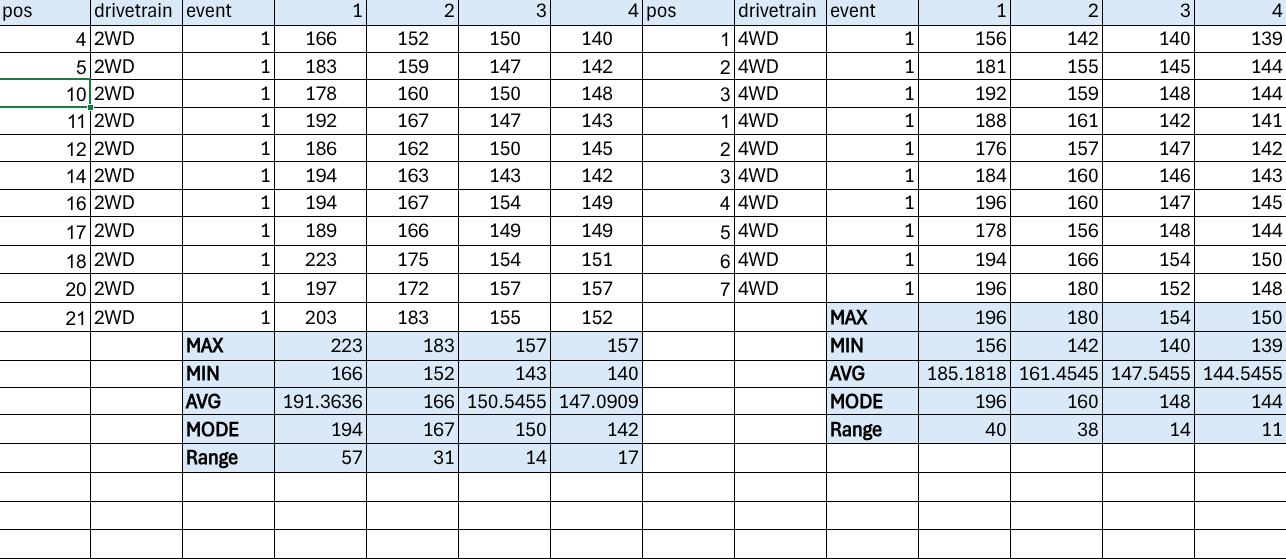
Table 3.1
Table 3.2
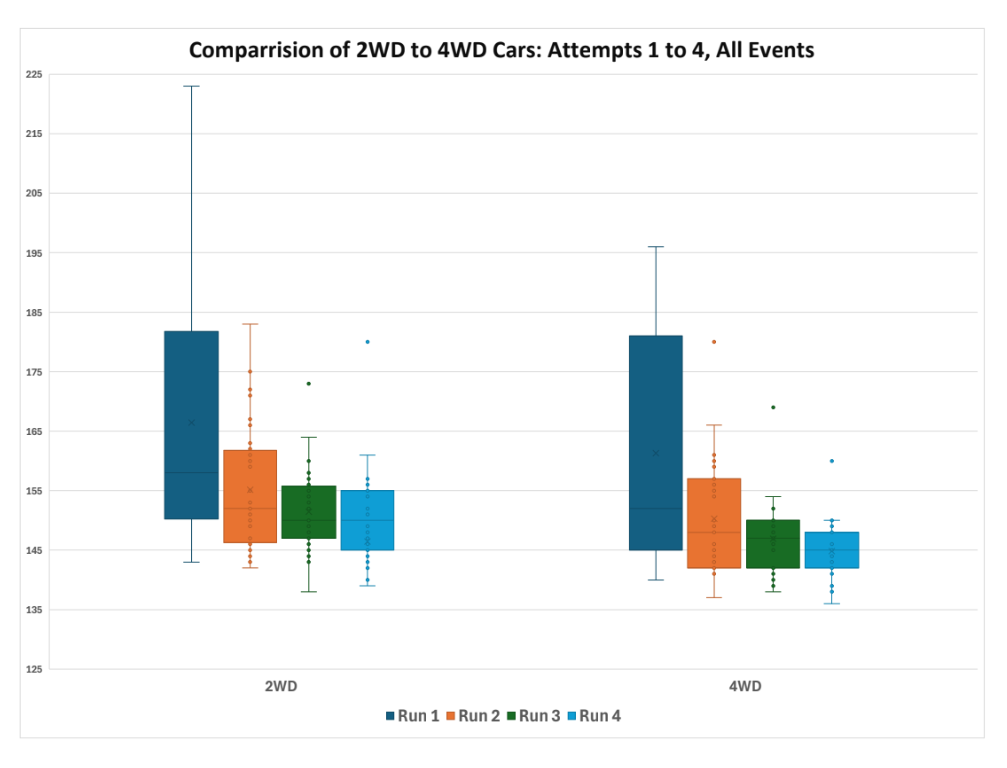
Analysis
I created a box and whisker plot, graph 3.0, which can be found below to examine whether or not there was a variation in the run attempts from the racing events. The first thing that I was able to see from this graph was that in the first box (blue) in the graph that there was more variation in the runtimes in the first attempt (blue). Meanwhile, the last attempt (light blue) had less variation and a smaller range.
This shows that performance increases over the attempts in each event that the drivers participate in. In both drivetrain types, 2WD and 4WD the cars show that between run 1 and run 4 that there is a decrease in run times, meaning that their lap times get faster. Becoming more familiar with a track and more consistent with driving around the area can contribute to their run times.
However, even though both driver train type cars both get faster with each run that they attempt, the average performance of the 4WD cars is consistently faster than the 2WD. This can be seen in graph 3.0, where the boxes show lower medians and means for 4WD meaning that they finish their run times faster and have less range.
The overall spread of the runtimes in this graph shows how the 4WD cars have less variability. For example, the 4WD cars have a range of 21 seconds and the 2WD cars have a range of 80 seconds. In rallycross racing, every second counts significantly and having a larger range and more variability means that it is less likely a car will do better than the other group.
Another aspect of this graph which shows this is the lines of the whiskers in graph 3.0. These lines, which are long and far away from the boxes, show how the range is quite great for the 2WD cars, meaning that they are the drivetrain type that has less chance of performing well.
This sub question of the distribution of the runtimes in each attempt helps to answer the thesis question and give a good visual of how there is more range for the 2WD cars. This doesn't mean that the cars always do poorly; the larger variation means that they do not always have a chance of winning. The same goes for the 4WD, the 4WD cars do not always constantly win; however, they do show that they have a significant consistency in wins. This helps to conclude that the 4WD cars have less variation, and for a performance rally that this type of car would be beneficial for a driver to choose.
Graph 3.0
Statistical:
Measures of central tendency
The mean, median, mode, and range.
The mean, also known as the average, shows the central fastest runtime. Calculating the mean of each run shows the average fastest runtime of each drivetrain type, which is very useful to help understand which drivetrain type, on average, is faster.
What I observed are two things: with each run the average run time improved and the 4WD average was always lower than 2WD average run time.
For example, in event 3, the final run times were 2WD: 141.3571s vs 4WD 140.8571s.
The mode is the most frequently occurring runtime for each drivetrain time in each specific event. From these tables/graph 3.0, the mode identifies where most of the data points are concentrated for the drivetrain types.
Observing the modes between the drivetrain types, I can see that the modes for the 4WD cars compared to the 2WD commonly have lower mode values meaning that with faster runtimes. The 4WD mode values cluster around 140-150, while the 2WD values cluster around 145-160.
The range: For the analysis I used a formula which calculated the range by subtracting the minimum value from the max value. I observed that the range typically lessens with each run in all but one. Although I calculated the range, the box and whisker plot provided a great visual analysis of this data.
Conclusion
In the 3 three events the 2WD cars had a chance of winning at times, however, the 4WD cars proved to be more consistent and faster throughout all the events looked at.
I can conclude from this study that 4WD cars are faster and more consistent at attaining top finishing positions.
Biases
Some bias that could have occurred when researching this study would be that the data for this research did have to be slightly cut. In the first two events of the data that I researched these two events originally had 31 people participating in the events. However, the third event that I looked at only had 22 people who were participating in the event. I made a decision to only look at the top 21 cars that participated in each event, because then all of the data had the same amount of participants and the number 21 was divisible by 3 and 7 which worked well for my graphs. However, because of this cut data this could have created a bias for the drive train type that was concluded to be the fastest. This is because by cutting off the bottom 10 cars, this could have skewed the data in favour for the better drivetrain type, the 4WD cars. Perhaps if the 2WD cars were not cut out of the data, maybe they would have had more of a chance to be the better drivetrain type and could have made the 4WD cars look better.
Suggestions/further investigations
For a suggestion to further improve this project would be to do a survey to determine what kinds of tires would be used in these kinds of rallycross events. For example, different tires like all seasons vs. summer tires vs. Competiton tires (A special type of tire that is designed for gravel and dirt that is more durable and sturdier. The tire is tougher than regular tires. Perhaps looking at this and performing a primary study and doing a survey would help me further understand whether types of tires or other aspects/parts of the cars give an advantage to the racers participating.
Bibliography (APA)
Kitchener Waterloo Rally Club Administrator. May 18, 2024. Rally Cross Series Event 1. Kitchener Waterloo Rally Club. June 12, 2025. https://kwrc.blither.net/registrants.asp?eid=63
Kitchener Waterloo Rally Club Administrator. June 22, 2024. Rally Cross Series Event 2. Kitchener Waterloo Rally Club. June 12, 2025. https://kwrc.blither.net/registrants.asp?eid=65
Kitchener Waterloo Rally Club Administrator. July 20, 2024. Rally Cross Series Event 3. Kitchener Waterloo Rally Club. June 12, 2025. https://kwrc.blither.net/registrants.asp?eid=66
David Gluckman. May 7, 2025. Two-Wheel Drive vs. Four-Wheel Drive. Car and Driver. June 12, 2025. https://www.caranddriver.com/features/a32799332/2-wheel-drive-vs-4-wheel-drive/
Paul Eklund. May 16, 2022. Learn the mudslinging secrets of top rallycross driver Paul Eklund. Grassroots Motorsports. June 12, 2025. https://grassrootsmotorsports.com/articles/learn-top-rallycross-drivers/
Event 1
Pos | Car # | Driver | Vehicle | Class | CPos | AX1 | AX2 | AX3 | AX4 | Total Time | Penalties | Grand Total | Behind | To Leader |
1 | 182 | Gavin Caissie | 2021 Can-Am X3 turbo | 4wdF | 1 | 02:35.8 | 02:21.9 | 02:19.5 | 02:19.2 | 07:00.6 | - | 07:00.6 | - | - |
2 | 4 | Alton Gonsalves | 2009 Subaru Impreza | 4wdN | 1 | 03:07.5 | 02:40.9 | 02:21.8 | 02:20.8 | 07:23.5 | - | 07:23.5 | 22.9 | 22.9 |
3 | 27 | Darin Mayes | 2005 Subaru Impreza RS | 4wdF | 2 | 03:01.0 | 02:34.6 | 02:25.3 | 02:24.3 | 07:24.2 | - | 07:24.2 | 0.7 | 23.6 |
4 | 66 | Justin Zammit | 2004 Nissan Sentra | 2wd | 1 | 02:46.3 | 02:32.5 | 02:29.5 | 02:20.5 | 07:22.5 | 5 | 07:27.5 | 3.3 | 26.9 |
5 | 97 | Brandon Pace | 2003 Nissan Sentra | 2wd | 2 | 03:02.9 | 02:39.0 | 02:27.2 | 02:21.7 | 07:27.9 | - | 07:27.9 | 0.4 | 27.3 |
6 | 2 | Sab Okazaki | 2005 Saab | 4wdF | 3 | 03:11.6 | 02:38.7 | 02:28.4 | 02:23.6 | 07:30.7 | - | 07:30.7 | 2.8 | 30.1 |
7 | 20 | Mark Gonsalves | 2009 Subaru Impreza | 4wdN | 2 | 02:55.8 | 02:36.9 | 02:27.1 | 02:21.9 | 07:25.9 | 5 | 07:30.9 | 0.2 | 30.3 |
8 | 15 | AJ Francis | 2006 Subaru Impreza | 4wdN | 3 | 03:03.6 | 02:39.5 | 02:26.4 | 02:23.5 | 07:29.4 | 5 | 07:34.4 | 3.5 | 33.8 |
9 | 5 | Billy Last | 2003 Subaru Forester X | 4wdN | 4 | 03:15.6 | 02:39.6 | 02:27.2 | 02:24.5 | 07:31.3 | 5 | 07:36.3 | 1.9 | 35.7 |
10 | 31 | Greg Stuurman | 2005 Toyota Echo | 2wd | 3 | 02:58.2 | 02:39.6 | 02:29.6 | 02:27.5 | 07:36.7 | - | 07:36.7 | 0.4 | 36.1 |
11 | 9 | Zoltan Kovacs | 2000 Honda Civic | 2wd | 4 | 03:11.9 | 02:47.3 | 02:27.0 | 02:22.9 | 07:37.2 | - | 07:37.2 | 0.5 | 36.6 |
12 | 25 | Donovan Kovacs | 2000 Honda Civic | 2wd | 5 | 03:05.8 | 02:42.4 | 02:30.1 | 02:24.7 | 07:37.2 | - | 07:37.2 | - | 36.6 |
13 | 21 | Mathieu Masaro | 2003 Subaru Forester | 4wdN | 5 | 02:58.0 | 02:35.5 | 02:28.4 | 02:24.0 | 07:27.9 | 10 | 07:37.9 | 0.7 | 37.3 |
14 | 18 | Storme Wroblewski | 2011 Ford Mustang | 2wd | 6 | 03:13.6 | 02:42.9 | 02:23.4 | 02:22.0 | 07:28.3 | 10 | 07:38.3 | 0.4 | 37.7 |
15 | 11 | Damian Pissarouk | 2005 Subaru Impreza | 4wdN | 6 | 03:14.0 | 02:45.8 | 02:34.0 | 02:29.5 | 07:49.3 | - | 07:49.3 | 11 | 48.7 |
16 | 28 | Cameron Kirkpatrick | 2005 Chrysler Crossfire | 2wd | 7 | 03:14.4 | 02:46.8 | 02:33.8 | 02:29.3 | 07:49.9 | - | 07:49.9 | 0.6 | 49.3 |
17 | 14 | Jordan Dickieson | 2000 Honda civic dx | 2wd | 8 | 03:08.6 | 02:45.6 | 02:28.7 | 02:28.7 | 07:43.0 | 10 | 07:53.0 | 3.1 | 52.4 |
18 | 12 | Chris Tellier | 2005 Chrysler Crossfire | 2wd | 9 | 03:42.6 | 02:54.5 | 02:34.0 | 02:30.7 | 07:59.2 | - | 07:59.2 | 6.2 | 58.6 |
19 | 3 | Jason Ronza | 2001 Subaru 2.5 RS | 4wdN | 7 | 03:16.3 | 03:00.1 | 02:31.8 | 02:28.2 | 08:00.1 | 5 | 08:05.1 | 5.9 | 01:04.5 |
20 | 41 | Barry Spinner | 2006 Honda Civic Si | 2wd | 10 | 03:17.4 | 02:52.1 | 02:37.1 | 02:36.9 | 08:06.1 | - | 08:06.1 | 1 | 01:05.5 |
21 | 34 | John Hido | 2006 Honda civic | 2wd | 11 | 03:22.6 | 03:02.7 | 02:34.9 | 02:31.7 | 08:09.3 | - | 08:09.3 | 3.2 | 01:08.7 |
22 | 26 | Michael Zona | 2007 Honda Honda Fit | 2wd | 12 | 03:23.9 | 02:51.0 | 02:40.3 | 02:42.9 | 08:14.2 | - | 08:14.2 | 4.9 | 01:13.6 |
23 | 6 | Connie Bell | 2006 Mazda Mazda3 Sport GT | 2wd | 13 | 03:39.7 | 03:03.5 | 02:39.7 | 02:40.5 | 08:23.7 | - | 08:23.7 | 9.5 | 01:23.1 |
24 | 16 | Tyler Publow | 1989 Volvo 245 | 2wd | 14 | 03:30.4 | 03:03.4 | 02:46.3 | 02:39.5 | 08:29.2 | - | 08:29.2 | 5.5 | 01:28.6 |
25 | 13 | Clayton McIntyre | 2011 Kia Forte Koop | 2wd | 15 | 03:22.9 | 03:04.7 | 02:46.5 | 02:38.6 | 08:29.8 | - | 08:29.8 | 0.6 | 01:29.2 |
26 | 24 | Gord Olmstead | 2008 Mazda 3 | 2wd | 16 | 03:15.0 | 02:59.5 | 02:50.0 | 02:47.3 | 08:36.8 | - | 08:36.8 | 7 | 01:36.2 |
27 | 22 | Brooke Jacobs | 2006 Mazda 3 | 2wd | 17 | 03:31.8 | 03:03.7 | 02:43.3 | 02:39.9 | 08:26.9 | 10 | 08:36.9 | 0.1 | 01:36.3 |
28 | 8 | Phil Hooper | 2008 Mazda 3 | 2wd | 18 | 03:42.0 | 03:03.8 | 02:49.4 | 02:48.9 | 08:42.1 | - | 08:42.1 | 5.2 | 01:41.5 |
29 | 30 | Joshua Rooney | 2008 Hyundai Accent | 2wd | 19 | 03:03.3 | 02:44.7 | 02:43.9 |
| 08:31.9 | 15 | 08:46.9 | 4.8 | 01:46.3 |
30 | 29 | Nicole McIntyre | 2011 Kia Forte Koop | 2wd | 20 | 03:24.2 | 03:03.0 | 02:48.7 | 02:48.3 | 08:40.0 | 10 | 08:50.0 | 3.1 | 01:49.4 |
31 | 17 | Patrick Stuurman | 2005 Toyota Echo | 2wd | 21 | 03:48.2 | 03:20.6 | 03:04.8 | 02:53.2 | 09:18.6 | 5 | 09:23.6 | 33.6 | 02:23.0 |
1 | 97 | Brandon Pace | 2004 Nissan Sentra | 2wd | 1 | 02:23.3 | 02:22.6 | 02:25.9 | 02:26.2 | 09:38.0 | - | 09:38.0 | - | - |
2 | 16 | Sab Okazaki | 2005 Saab | 4wdF | 1 | 02:24.7 | 02:22.3 | 02:25.8 | 02:26.1 | 09:38.9 | - | 09:38.9 | 0.9 | 0.9 |
3 | 22 | Alton Gonsalves | 2009 Subaru Impreza | 4wdN | 1 | 02:26.7 | 02:23.4 | 02:26.7 | 02:24.6 | 09:41.4 | - | 09:41.4 | 2.5 | 3.4 |
4 | 66 | Justin Zammit | 2004 Nissan Sentra | 2wd | 2 | 02:27.0 | 02:23.5 | 02:26.6 | 02:27.4 | 09:44.5 | - | 09:44.5 | 3.1 | 6.5 |
5 | 19 | Jason Ronza | 2001 Subaru 2.5 RS | 4wdN | 2 | 02:26.5 | 02:23.1 | 02:29.9 | 02:25.5 | 09:45.0 | - | 09:45.0 | 0.5 | 7 |
6 | 15 | Aj Francis | 2006 Subaru Impreza | 4wdN | 3 | 02:29.6 | 02:24.6 | 02:24.7 | 02:25.0 | 09:43.9 | 5 | 09:48.9 | 3.9 | 10.9 |
7 | 21 | Darin Mayes | 2005 Subaru Impreza RS | 4wdF | 2 | 02:24.9 | 02:23.9 | 02:27.0 | 02:25.1 | 09:40.9 | 10 | 09:50.9 | 2 | 12.9 |
8 | 18 | Damian Pissarouk | 2004 Subaru Impreza | 4wdN | 4 | 02:29.4 | 02:29.1 | 02:28.8 | 02:29.1 | 09:56.4 | - | 09:56.4 | 5.5 | 18.4 |
9 | 10 | Matt Tregunno | 1998 Subaru RS25 | 4wdN | 5 | 02:30.2 | 02:25.8 | 02:32.4 | 02:29.7 | 09:58.1 | - | 09:58.1 | 1.7 | 20.1 |
10 | 6 | Mark Gonsalves | 2009 Subaru Impreza | 4wdN | 6 | 02:29.4 | 02:27.7 | 02:30.3 | 02:28.7 | 09:56.1 | 5 | 10:01.1 | 3 | 23.1 |
11 | 5 | Andrew Marek | 2006 Subaru Impreza RS | 4wdN | 7 | 02:32.5 | 02:28.5 | 02:32.2 | 02:30.3 | 10:03.5 | - | 10:03.5 | 2.4 | 25.5 |
12 | 24 | Zoltan Kovacs | 2004 Hyundai Accent | 2wd | 3 | 02:30.2 | 02:26.1 | 02:32.8 | 02:36.5 | 10:05.6 | - | 10:05.6 | 2.1 | 27.6 |
13 | 28 | Jim Morton | 2006 Mitsubishi Lancer | 2wd | 4 | 02:30.1 | 02:31.5 | 02:32.0 | 02:32.0 | 10:05.6 | - | 10:05.6 | - | 27.6 |
14 | 3 | Gregory Stuurman | 2005 Toyota Echo | 2wd | 5 | 02:32.6 | 02:31.7 | 02:30.3 | 02:31.5 | 10:06.1 | - | 10:06.1 | 0.5 | 28.1 |
15 | 4 | Storme Wroblewski | 2011 Ford Mustang | 2wd | 6 | 02:34.4 | 02:29.4 | 02:33.8 | 02:31.9 | 10:09.5 | - | 10:09.5 | 3.4 | 31.5 |
16 | 7 | Jordan Dickieson | 2000 Honda civic dx | 2wd | 7 | 02:34.4 | 02:29.7 | 02:33.3 | 02:33.9 | 10:11.3 | - | 10:11.3 | 1.8 | 33.3 |
17 | 29 | Max Sverdlov | 2003 Honda Civic | 2wd | 8 | 02:34.0 | 02:30.0 | 02:33.9 | 02:31.9 | 10:09.8 | 10 | 10:19.8 | 8.5 | 41.8 |
18 | 12 | Chris Tellier | 2005 Chrysler Crossfire | 2wd | 9 | 02:42.6 | 02:34.5 | 02:36.3 | 02:35.2 | 10:28.6 | - | 10:28.6 | 8.8 | 50.6 |
19 | 14 | Max Nitz | 2008 Honda Civic | 2wd | 10 | 02:37.0 | 02:32.5 | 02:44.1 | 02:35.1 | 10:28.7 | - | 10:28.7 | 0.1 | 50.7 |
20 | 8 | Donovan Kovacs | 2004 Hyundai Accent | 2wd | 11 | 02:46.4 | 02:41.2 | 02:38.1 | 02:34.7 | 10:40.4 | - | 10:40.4 | 11.7 | 01:02.4 |
21 | 182 | Gavin Caissie | 2015 Mercedes-Benz GLA45 | 4wdF | 3 | 02:34.7 | 02:33.6 | 02:48.7 | 02:39.9 | 10:36.9 | 5 | 10:41.9 | 1.5 | 01:03.9 |
22 | 27 | Cameron Kirkpatrick | 2005 Chrysler Crossfire | 2wd | 12 | 02:45.0 | 02:34.6 | 02:48.1 | 02:43.2 | 10:50.9 | - | 10:50.9 | 9 | 01:12.9 |
23 | 26 | Gord Olmstead | 2008 Mazda 3 | 2wd | 13 | 02:44.6 | 02:45.5 | 02:47.2 | 02:45.9 | 11:03.2 | - | 11:03.2 | 12.3 | 01:25.2 |
24 | 11 | Phil Hooper | 2008 Mazda 3 | 2wd | 14 | 02:46.1 | 02:44.3 | 02:49.0 | 02:45.6 | 11:05.0 | - | 11:05.0 | 1.8 | 01:27.0 |
25 | 20 | Lukasz Chlebek | 2013 Volkswagen Golf 4 Motion | 4wdF | 4 | 02:30.1 | 02:24.6 |
| 02:26.1 | 11:20.8 | - | 11:20.8 | 15.8 | 01:42.8 |
26 | 23 | Martin Hubert | 2000 Honda civic dx | 2wd | 15 | 02:34.6 |
| 02:35.8 | 02:35.9 | 11:46.3 | - | 11:46.3 | 25.5 | 02:08.3 |
27 | 31 | Ushan Wickaramarathne | 2005 Toyota Corola | 2wd | 16 | 03:03.5 | 02:58.2 | 03:00.5 | 02:56.7 | 11:58.9 | 5 | 12:03.9 | 17.6 | 02:25.9 |
28 | 30 | Joshua Rooney | 2008 Hyundai Accent | 2wd | 17 | 02:50.5 | 02:44.5 | 02:47.5 |
| 12:22.5 | 5 | 12:27.5 | 23.6 | 02:49.5 |
29 | 13 | Terrence Lam | 2004 BMW 325XI | 4wdN | 8 | 03:03.8 | 03:34.2 | 03:05.4 | 03:00.2 | 12:43.6 | - | 12:43.6 | 16.1 | 03:05.6 |
30 | 33 | Caleb Jukes | 1964 Ford Falcon | 2wd | 18 | 03:09.1 | 03:04.8 |
| 03:07.9 | 13:21.8 | - | 13:21.8 | 38.2 | 03:43.8 |
31 | 34 | Daniel Lo | 2004 BMW 325XI | 4wdN | 9 | 03:25.6 |
| 03:23.9 |
| 14:49.5 | - | 14:49.5 | 01:27.7 | 05:11.5 |
Event 3
1 | 24 | Sab Okazaki | 2005 Saab | 4wdF | 1 | 02:20.4 | 02:17.1 | 02:18.0 | 02:16.4 | 11:18.6 | - | 11:18.6 | - | - |
2 | 4 | Alton Gonsalves | 2009 Subaru Impreza | 4wdN | 1 | 02:21.7 | 02:21.5 | 02:19.7 | 02:18.3 | 11:35.0 | - | 11:35.0 | 16.4 | 16.4 |
3 | 25 | Darin Mayes | 2005 Subaru Impreza RS | 4wdF | 2 | 02:38.3 | 02:21.9 | 02:18.7 | 02:22.2 | 11:40.1 | - | 11:40.1 | 5.1 | 21.5 |
4 | 97 | Brandon Pace | 2003 Nissan Sentra | 2wd | 1 | 02:27.2 | 02:22.2 | 02:23.7 | 02:18.8 | 11:42.6 | - | 11:42.6 | 2.5 | 24 |
5 | 88 | Aj Francis | 2006 Subaru Impreza | 4wdN | 2 | 02:22.8 | 02:20.9 | 02:21.3 | 02:18.5 | 11:42.9 | - | 11:42.9 | 0.3 | 24.3 |
6 | 2 | Jason Ronza | 2001 Subaru 2.5 RS | 4wdN | 3 | 02:25.5 | 02:22.4 | 02:22.4 | 02:20.9 | 11:43.3 | - | 11:43.3 | 0.4 | 24.7 |
7 | 66 | Justin Zammit | 2004 Nissan Sentra | 2wd | 2 | 02:29.3 | 02:24.3 | 02:18.2 | 02:23.1 | 11:53.4 | - | 11:53.4 | 10.1 | 34.8 |
8 | 17 | Mark Gonsalves | 2009 Subaru Impreza | 4wdN | 4 | 02:24.8 | 02:25.1 | 02:22.3 | 02:23.2 | 11:51.6 | 5 | 11:56.6 | 3.2 | 38 |
9 | 9 | Storme Wroblewski | 2011 Ford Mustang | 2wd | 3 | 02:27.1 | 02:23.8 | 02:23.9 | 02:23.9 | 11:57.3 | - | 11:57.3 | 0.7 | 38.7 |
10 | 5 | Jordan Dickieson | 2000 Honda civic dx | 2wd | 4 | 02:27.9 | 02:26.1 | 02:25.4 | 02:24.6 | 12:03.8 | - | 12:03.8 | 6.5 | 45.2 |
11 | 48 | Gregory Stuurman | 2005 Toyota Echo | 2wd | 5 | 02:28.3 | 02:26.4 | 02:24.6 | 02:26.9 | 12:05.0 | - | 12:05.0 | 1.2 | 46.4 |
12 | 46 | Ian Gagnon | 2008 Honda Civic Si | 2wd | 6 | 02:39.1 | 02:24.6 | 02:24.8 | 02:35.8 | 12:14.2 | - | 12:14.2 | 9.2 | 55.6 |
13 | 7 | Zoltan Kovacs | 2004 Hyundai Accent | 2wd | 7 | 02:30.7 | 02:26.5 | 02:27.6 | 02:27.9 | 12:18.0 | - | 12:18.0 | 3.8 | 59.4 |
14 | 3 | Damian Pissarouk | 2004 Subaru Impreza | 4wdN | 5 | 02:32.0 | 02:30.3 | 02:29.4 | 02:27.5 | 12:21.7 | - | 12:21.7 | 3.7 | 01:03.1 |
15 | 18 | Martin Hubert | 2000 Honda civic dx | 2wd | 8 | 02:31.5 | 02:29.0 | 02:27.2 | 02:28.2 | 12:17.1 | 5 | 12:22.1 | 0.4 | 01:03.5 |
16 | 20 | Donovan Kovacs | 2004 Hyundai Accent | 2wd | 9 | 02:49.2 | 02:31.1 | 02:29.6 | 02:41.5 | 12:42.1 | - | 12:42.1 | 20 | 01:23.5 |
17 | 26 | Michael Zona | 2007 Honda Honda Fit | 2wd | 10 | 02:35.5 | 02:33.0 | 02:36.6 | 02:34.9 | 12:44.5 | - | 12:44.5 | 2.4 | 01:25.9 |
18 | 23 | Alex Custance | 2016 Honda civic | 2wd | 11 | 02:57.6 | 02:41.2 | 02:39.5 | 02:35.9 | 13:10.5 | - | 13:10.5 | 26 | 01:51.9 |
19 | 14 | Joshua Rooney | 2008 Hyundai Accent | 2wd | 12 | 02:45.9 | 02:40.5 | 02:37.3 | 02:36.5 | 13:14.8 | - | 13:14.8 | 4.3 | 01:56.2 |
20 | 21 | Patrick Stuurman | 2005 Toyota Echo | 2wd | 13 | 02:56.2 | 02:50.7 | 02:52.8 | 02:59.7 | 14:07.7 | - | 14:07.7 | 52.9 | 02:49.1 |
21 | 57 | Chris Tellier | 2005 Chrysler Crossfire | 2wd | 14 | 02:30.8 | 02:29.1 | 02:35.9 |
| 15:35.8 | - | 15:35.8 | 01:28.1 | 04:17.2 |
22 | 8 | Cameron Kirkpatrick | 2005 Chrysler Crossfire | 2wd | 15 | 02:39.7 | 02:33.4 | 03:49.8 | 02:34.7 | 15:37.6 | 5 | 15:42.6 | 6.8 | 04:24.0 |


Comments
Post a Comment